Most people who search “how does compound interest work” already suspect the answer matters. They’ve heard the concept before. They may even have money invested. But there is a difference between knowing compound interest exists and understanding what it actually costs you to wait. That difference, measured in real dollars, is the gap between retiring at 50 and retiring at 60.
This article explains the mechanism once, briefly, and then focuses where it counts: on the FIRE-scale math that shows exactly how much time and money are at stake. You’ll see the numbers, run your own with the embedded FIRE Calculator, and leave with a specific next step.
The Mechanism in 60 Seconds
Compound interest means you earn returns on your returns. With simple interest, a $10,000 investment earning 7% generates $700 every year, forever. With compound interest, that $700 gets added to your balance, and next year you earn 7% on $10,700 instead.
The formula looks like this:
A = P(1 + r/n)^(nt)
Where:
- A = final amount
- P = initial principal
- r = annual interest rate (as a decimal)
- n = number of times interest compounds per year
- t = number of years
You don’t need to memorize it. What matters is what it produces over time, and the three variables inside it that you can actually control. We’ll get to those. First, the part most explanations understate.
The Cost of Waiting Is Not Linear
Here is the claim that should change how you think about your timeline: the penalty for starting late grows faster than the delay itself.
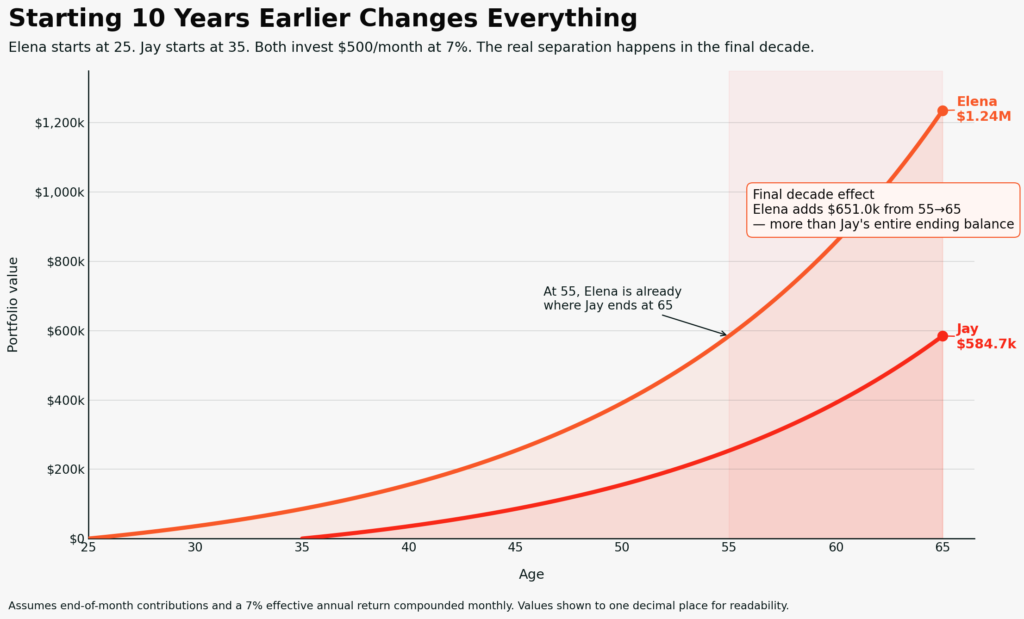
Consider two investors, both contributing $400 per month at a 7% annual return, compounded monthly, investing until age 65.
Elena starts at 25. Jay starts at 35.
| Elena (starts at 25) | Jay (starts at 35) | |
|---|---|---|
| Monthly contribution | $400 | $400 |
| Years investing | 40 | 30 |
| Total contributed | $192,000 | $144,000 |
| Portfolio at 65 | $1,049,925 | $487,988 |
| Interest earned | $857,925 | $343,988 |
Elena contributed $48,000 more than Jay. Her portfolio is worth $561,937 more. The extra contributions account for less than 9% of that gap. The other 91% is compounding time she had that Jay did not.
That $561,937 isn’t an abstraction. For someone pursuing financial independence, it translates directly into years of freedom. At a 4% safe withdrawal rate, the gap between their portfolios represents roughly $22,500 per year in retirement income, or several additional years at a job Jay could have left sooner.
To see the non-linear penalty more clearly, here’s what happens at several starting ages, all at $400 per month, 7% return, investing to age 65:
| Starting age | Years investing | Total contributed | Portfolio at 65 |
|---|---|---|---|
| 25 | 40 | $192,000 | $1,049,925 |
| 27 | 38 | $182,400 | $904,199 |
| 30 | 35 | $168,000 | $720,422 |
| 33 | 32 | $153,600 | $571,364 |
| 35 | 30 | $144,000 | $487,988 |
| 40 | 25 | $120,000 | $324,029 |
The five years between starting at 25 and starting at 30 cost $329,503 in final portfolio value. The five years between starting at 35 and starting at 40 cost $163,959. Both are five-year delays, but the early delay destroys twice as much wealth because those first years sit at the widest part of the compounding curve. If you’re in your late 20s wondering whether this year or next year matters, the table above is the answer: it does.
One thing that stood out while running these numbers: the interest Elena earned ($857,925) is more than four times what she actually put in ($192,000). Jay’s interest ($343,988) is only 2.4 times his contributions. Same monthly amount, same return rate. The only variable that changed was time.
Why Time Is the Dominant Variable
It’s intuitive that starting earlier helps. What’s less intuitive is that time is more powerful than contribution size over a long horizon.
Jay, from the example above, could try to catch up by doubling his contributions to $800 per month. After 30 years at 7%, he’d accumulate roughly $975,977. That’s impressive, but still $73,949 less than Elena’s $1,049,925, despite contributing $288,000 to her $192,000.
Elena invested $96,000 less and ended with more money. That’s the asymmetry of compounding: early dollars have more time to multiply, and no amount of late-stage effort fully compensates.
This is also why Coast FIRE works as a strategy. If you invest aggressively in your 20s and early 30s, the portfolio can compound to your target number without additional contributions. You’ve already loaded the front end. The remaining decades do the work for you. Someone who accumulates $200,000 by age 30 and never contributes another dollar could see that grow to roughly $1.5 million by age 60 at a 7% return, based on the Rule of 72 (three doublings over 30 years). That’s the practical meaning of “time is the dominant variable.” The money doesn’t need you to keep feeding it. It needs you to have started.
The implication for someone who feels behind is worth stating directly. You cannot go back and invest at 22. But every month you delay from this point forward is a month at the steepest part of the curve you’ll ever have access to, because today is always the earliest you can start.
The Rule of 72: A Shortcut Worth Knowing
If you want to estimate how long it takes your money to double, divide 72 by your expected annual return.
At a 7% return: 72 ÷ 7 = approximately 10.3 years to double.
At a 10% return: 72 ÷ 10 = roughly 7.2 years.
The Rule of 72 was first documented by the Italian mathematician Luca Pacioli in 1494 and remains one of the most practical mental shortcuts in investing. It works best for return rates between 5% and 10%, which is exactly the range most FIRE investors plan around.
Here’s where it becomes useful for planning. If you have $50,000 invested at 7%, the Rule of 72 tells you it will grow to approximately $100,000 in about 10 years, then $200,000 ten years after that, then $400,000 ten years after that. Each doubling happens on a larger base. The third doubling adds $200,000; the first added only $50,000. Same time interval, four times the dollars.
The Rule of 72 also works in reverse to estimate the damage of inflation and fees. At 3% inflation, your money’s purchasing power halves in about 24 years (72 ÷ 3 = 24). At a 1% annual fee on top of that, the effective drag on your real returns compounds quietly in the background. Being able to run these estimates in your head, without a calculator, is one of the most useful financial skills you can develop. It turns abstract percentages into concrete timelines.
This is why the advice to “start now, even with a small amount” isn’t motivational fluff. It’s math. The first dollars you invest have the most doublings ahead of them.
The Rule of 72 also works in reverse as a fee calculator. If your investment fund charges 1% in annual fees, divide 72 by 1: it takes roughly 72 years for fees to cut your portfolio value in half. That sounds distant until you realize it means fees reduce your balance by approximately a quarter over 36 years. At 2% in fees, the halving time drops to 36 years, meaning you’d lose roughly a quarter of your portfolio’s potential growth in just 18 years. This is why the fee lever, covered below, deserves as much attention as the contribution lever.
How Compounding Frequency Works (And Why It Matters Less Than You Think)
The “n” in the compound interest formula represents how often interest compounds: annually, monthly, daily. A reasonable question is whether compounding more frequently produces meaningfully different results.
On a $10,000 lump sum at 7% over 30 years:
| Compounding frequency | Final value |
|---|---|
| Annually | $76,123 |
| Monthly | $81,165 |
| Daily | $81,645 |
The jump from annual to monthly compounding adds about $5,000 over three decades. The jump from monthly to daily adds less than $500. For practical purposes, monthly compounding captures nearly all the benefit. Most brokerage accounts and index funds compound returns continuously through daily market pricing, so this distinction rarely requires action on your part.
The takeaway: compounding frequency is worth understanding but not worth optimizing. Your time and energy are better spent on the three variables you directly control.
The Three Levers You Actually Control
Compound interest has three inputs you can influence. Each one changes your FIRE timeline in a different way.
Lever 1: When You Start
This is the most powerful lever and the least forgiving. Every year of delay shortens the compounding runway, and that time cannot be bought back with larger contributions later. Elena and Jay’s example above is the proof. If you haven’t started investing yet, the single highest-return action you can take is to open an account this week. It doesn’t need to be optimized. It needs to exist. The brokerage account guide walks through how to choose one.
Lever 2: How Much You Contribute
At $400 per month and a 7% return, reaching $750,000 takes approximately 35.5 years. At $600 per month with the same return, it takes about 30.3 years. That extra $200 per month buys you roughly five years of freedom.
Contribution size matters most in combination with time. If you’re already investing, increasing your savings rate is the most direct way to accelerate your timeline. Going from a 10% savings rate to a 20% savings rate doesn’t just double the speed; it does more than that, because the additional contributions also compound.
Lever 3: What You Lose to Fees
This is the lever most people overlook, and it operates in reverse. Investment fees don’t just reduce your return in a single year. They reduce the base that compounds for every subsequent year.
Consider $400 per month over 40 years. At a 7% net return, the portfolio reaches $1,049,925. At 6% (after a 1% annual fee), it reaches $796,596. That 1% fee costs $253,329 over 40 years.
Over 30 years, the same 1% fee costs $86,182. The longer you invest, the more fees compound against you.
The practical fix is straightforward: choose low-cost index funds with expense ratios below 0.10% whenever possible. To see why, consider $400 per month over 30 years at a 7% gross return, with different fee levels eating into that return:
| Annual fee | Net return | Portfolio after 30 years | Cost of fees |
|---|---|---|---|
| 0.03% (e.g., total market index fund) | 6.97% | $485,110 | $2,878 |
| 0.50% | 6.50% | $442,471 | $45,517 |
| 1.00% | 6.00% | $401,806 | $86,182 |
| 1.50% | 5.50% | $365,445 | $122,543 |
The difference between a 0.03% index fund and a 1.50% actively managed fund is $119,665 over 30 years, on the same contributions and the same gross market return. That’s money transferred from your retirement to a fund manager. The investment portfolio guide covers how to build a portfolio that minimizes fee drag while staying diversified.
Run Your Own Numbers
The examples above use $400 per month at 7% because those are plausible starting numbers for someone early in their FIRE path. Your numbers are different. Your income, savings capacity, and timeline are your own.
Use the FIRE Calculator to plug in your actual situation. Adjust the contribution, the expected return, and your target number. See how many years each change adds or subtracts. The gap between your current trajectory and the one you want is the most useful number you’ll find today.
What About Inflation?
A common and fair objection: if the S&P 500 has returned an average of about 10% annually since 1957 (according to data from S&P Dow Jones Indices, confirmed by sources including Fidelity and Dimensional Fund Advisors), and inflation has historically averaged around 3%, then the real return is closer to 7%.
That’s exactly why this article uses 7% throughout. The numbers above already approximate inflation-adjusted growth. A portfolio that reaches $1,049,925 in today’s calculations represents roughly that amount in today’s purchasing power, not nominal dollars that will buy less in 40 years.
If you want to be more conservative, model at 6%. The conclusions don’t change; the timelines stretch by a few years. The core principle holds: compounding rewards time more than almost any other variable.
What Compound Interest Cannot Do
Compound interest is not a guarantee of returns. Stock markets fluctuate. A 7% average annual return includes years of 25% gains and years of 20% losses. The average holds over long periods, but individual years vary widely. According to Dimensional Fund Advisors, the S&P 500 has landed within 2 percentage points of its 10% historical average in only six of the past 93 calendar years.
This volatility is why the numbers in this article assume consistent monthly contributions rather than a single lump sum. Contributing the same amount every month, regardless of whether the market is up or down, is a practice called dollar-cost averaging. When prices are low, your $400 buys more shares. When prices are high, it buys fewer. Over decades, this smooths out the effects of short-term volatility and means you don’t need to predict market timing to benefit from compounding.
This is also why FIRE investors pair compounding with diversification, consistent contributions regardless of market conditions, and a long enough time horizon to ride out volatility. The 2008 financial crisis saw the S&P 500 drop roughly 37% in a single year. An investor who kept contributing $400 per month through that decline was buying shares at a steep discount. Those shares, purchased near the bottom, benefited from the subsequent decade-long recovery. Compounding rewarded patience. If you’re still building your investment knowledge, How to Start Investing covers the foundational decisions.
Compound interest also doesn’t help money you haven’t invested. Cash sitting in a checking account earning 0.01% is compounding, technically, but at a rate that inflation erases entirely. The mechanism only works when paired with a return rate that outpaces inflation, and that typically means equities.
Frequently Asked Questions
What is the difference between compound interest and simple interest?
Simple interest pays a fixed percentage on your original principal only. If you invest $10,000 at 7% simple interest, you earn $700 per year regardless of how long the money is invested. After 30 years, you’d have $31,000. Compound interest pays returns on both the principal and all previously earned interest. That same $10,000 at 7% compounded annually would grow to $76,123 over 30 years, more than double the simple interest result.
How often does compound interest compound, and does it matter?
It depends on the investment vehicle. Savings accounts typically compound daily. Bonds may compound semiannually. Stock market investments effectively compound continuously, since returns are reflected in daily share prices. The difference between monthly and daily compounding on a $10,000 investment at 7% over 30 years is less than $500. Compounding frequency matters far less than your return rate, contribution amount, and time in the market.
What does the Rule of 72 tell me, and how do I use it?
Divide 72 by your expected annual return to estimate how many years it takes your money to double. At 7%, your money doubles roughly every 10.3 years. At 10%, roughly every 7.2 years. The rule is an approximation that’s most accurate between 5% and 10%, which covers the range most long-term investors plan around. It’s useful for back-of-the-envelope planning when you want to gauge how your portfolio might grow without running a full calculation.
Is it too late to benefit from compound interest if I’m starting in my 30s or 40s?
No. Starting later means you have a shorter compounding runway, which makes the other two levers (contribution amount and fee reduction) more important. Someone starting at 35 with $600 per month at 7% reaches $750,000 in about 30 years. That’s still a viable path to financial independence by 65, and increasing contributions or reducing expenses can shorten the timeline further. The worst outcome isn’t starting late; it’s not starting.
Key Takeaways
Compound interest is the mechanism that makes early retirement mathematically possible. The math favors three things: starting as soon as you can, contributing as much as you can sustain, and keeping fees as low as possible. Time is the most powerful of the three because it’s the one you can never recover once it’s gone.
The gap between starting at 25 and starting at 35, on identical monthly contributions, is over half a million dollars. Not because of what was contributed, but because of what compounded. Every year of delay subtracts more than the last.
If you haven’t already, run your own numbers in the FIRE Calculator. See where you are, where you could be, and what one change to your contributions or start date would mean for your timeline.
If you don’t yet have a brokerage account, that’s the next step: the brokerage account guide will help you choose one and get started.
For a deeper look at the data behind consistent investing, Nick Maggiulli’s Just Keep Buying is one of the best modern, evidence-based books on building wealth through regular contributions. It’s especially useful if you understand compounding but have been hesitant to start.
As an Amazon Associate, I earn from qualifying purchases, at no additional cost to you.